ECONOMY In Q4 2024
The Las Vegas market reached an employment level of 1.2 million jobs, alongside a slight quarter-over-quarter (QOQ) increase of 40 basis points (bps) in the unemployment rate to 6.0%. However, expectations point toward future improvement. The Las Vegas metro area witnessed robust growth, with households increasing by 2.7% year-over-year (YOY) to 930,500. Additionally, wage growth continues to draw job seekers into the market, as the median household income climbed to $78,600—a 3.1% YOY rise.
SUPPLY
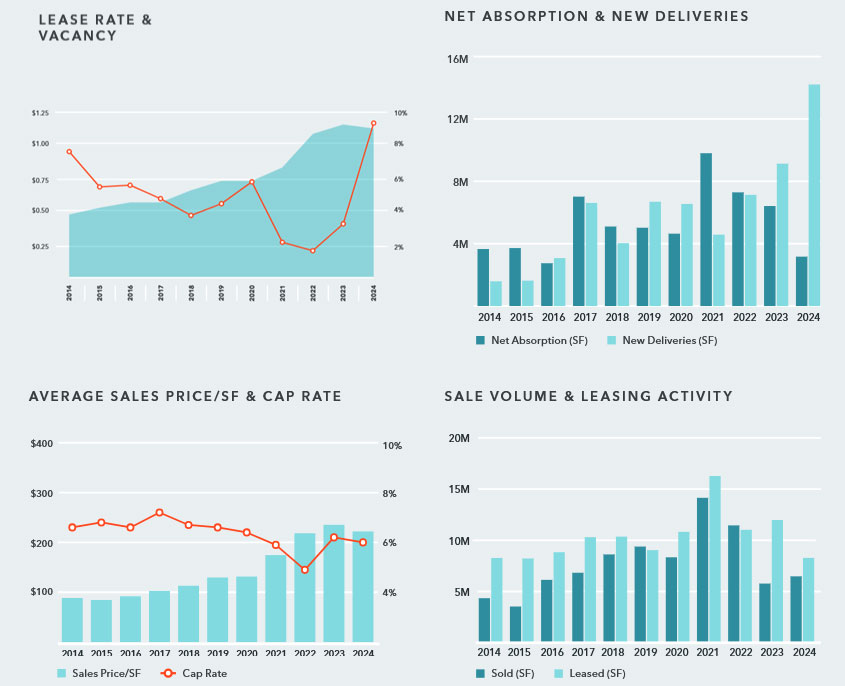
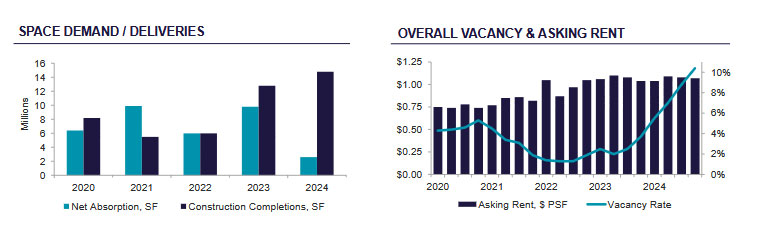
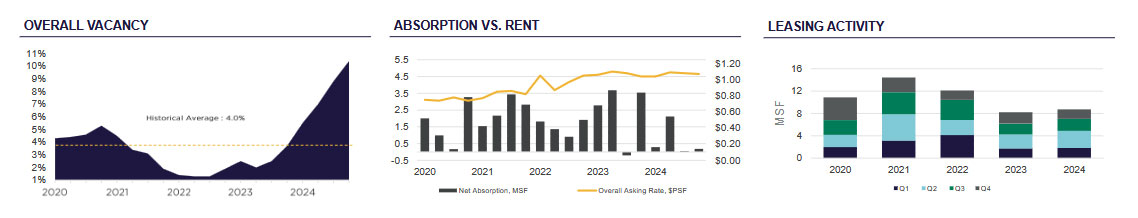
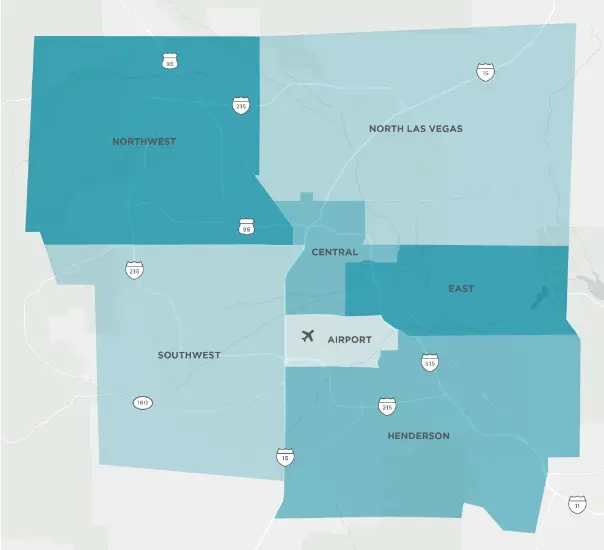
The Las Vegas industrial market recorded a vacancy rate of 10.4% in Q4 2024, marking a 160 bps QOQ and 670 bps YOY increase. Direct vacancy rose to 9.8% (+160 bps QOQ), while sublease vacancy edged up to 0.6% (+10 bps QOQ), adding 100,000 square feet (sf) quarter-over-quarter and over 1 million square feet (msf) YOY. New sublease listings were predominantly concentrated in submarkets like North Las Vegas (85,967 sf), Southwest (159,249 sf), Henderson (108,745 sf), and Airport (98,591 sf).
The 14.8 msf of new supply delivered throughout 2024—including 3.3 msf in Q4—pushed vacancy rates to the highest levels since 2014. North Las Vegas saw the highest vacancy rate at 15.0%, influenced by 1.8 msf in Q4 deliveries. Conversely, Central and Northwest submarkets maintained the lowest vacancy rates at 3.2% and 3.6%, benefiting from smaller industrial bases and limited development. Rising vacancy rates in Henderson (+240 bps QOQ), North Las Vegas (+180 bps QOQ), and Southwest (+160 bps QOQ) were driven by substantial new deliveries, creating a temporary supply-demand imbalance as developers target long-term growth.
LEASING ACTIVITY
Leasing activity in Q4 2024 reached 1.6 msf, with the year-to-date (YTD) total rising to 8.6 msf—a 26.1% QOQ and 22% YOY decline compared to Q4 2023. Although 2024 leasing activity was 5% higher than in 2023, it fell 20.4% below the five-year average of 10.8 msf, reflecting stabilization following the e-commerce surge and a return to pre-pandemic norms.
Demand for shallow bay properties remained strong, with 93% of Q4 deals under 50,000 sf and the average deal size being 13,100 sf. North Las Vegas dominated leasing activity, accounting for 58% of Q4 activity (900,000 sf) and 50% of YTD activity (4.3 msf). Southwest leasing activity grew 29% YOY to 2.5 msf YTD, while Henderson leasing activity climbed 28.1% YOY to 844,246 sf YTD, supported by modern facilities, transportation routes, labor pools, and nearby amenities.
ABSORPTION In Q4 2024
Positive absorption reached 183,991 sf, bringing the YTD total to 2.6 msf—up 130,000 sf from the previous quarter but down 3.5 msf YOY from Q4 2023. This marks the lowest absorption total in five years due to delayed occupancies and softer leasing figures, falling 7 msf below 2023 levels and 4.3 msf below the five-year average.
North Las Vegas led Q4 absorption with 180,000 sf (+360,000 sf QOQ), representing 90% of YTD absorption (2.3 msf). Key move-ins included Borderless Distribution (114,400 sf) at Windsor Commerce Park and Ontel Products (72,531 sf) at Prologis Corporate Center. Other submarkets like Southwest (465,823 sf) and Henderson (299,767 sf) also performed well, buoyed by significant move-ins such as MGM (50,736 sf) at MSI Industrial Center and Crown Equipment (56,816 sf) at South 95 Logistics.
The Airport submarket recorded the highest negative absorption at 75,117 sf in Q4 and 302,902 sf YTD, driven by increased sublease availabilities from properties such as Compass Logistic Center (37,350 sf) and Prologis Warm Springs Business Center (20,000 sf).
FUTURE INVENTORY Las Vegas’s
Industrial expansion continued with 3.3 msf added across 21 buildings in Q4 2024, bringing the YTD total to 14.8 msf—representing a 9.4% YOY market footprint increase. Noteworthy completions included Desert Willow Logistics Center (721,204 sf), Becknell Galleria (672,319 sf), and Oasis Commerce Center (422,020 sf).
With 5.7 msf currently under construction (6.9% pre-leased), Las Vegas remains among the top 15 U.S. industrial development markets. Expected 2025 deliveries include Moonwater West @ Apex (922,569 sf) and Warm Springs Commerce Center (504,768 sf). However, new project launches are slowing as developers anticipate lower vacancy rates, stable costs, and heightened demand to absorb current inventory.
PRICING
The average asking rent across all product types remained steady QOQ at $1.07 per square foot (psf) on a monthly triple net (NNN) basis, marking a 2.9% YOY increase. The Northwest submarket experienced the largest QOQ jump (+5.8%) to $1.29 psf, reflecting supply constraints. In contrast, Henderson saw rents decline 4.3% QOQ to $1.02 psf due to new inventory entering the market.
Southwest commanded the highest rental rates at $1.32 psf (+2.9% QOQ), influenced by modern facilities, premium locations, and labor pool accessibility. Despite a slight 0.9% QOQ rise, North Las Vegas continued to offer the most affordable rates at $0.98 psf, driven by its large-scale distribution facilities and competitive leasing options.
Stable rental rates are anticipated, but rising vacancy may encourage landlords to differentiate offerings in oversupplied submarkets.
OUTLOOK
The Las Vegas industrial market remains positioned for long-term growth as developers, tenants, and investors adapt to evolving market dynamics. With strategic developments and sector diversification underway, Las Vegas continues to cement its role as a competitive hub for industrial opportunities.